
We're still a relatively small engineering team at Duffel. However, we wanted to add observability early and with minimal effort in our product's life cycle.
We use observability to mean being able to answer any questions about what is happening inside our system at any point in time just by "observing" the external signals (i.e. call frequency, timings, etc.) that the same system provides us with.
In this blogpost we walk you through how our team has leveraged simple, off-the-shelf, solutions to observability in order to become a more efficient and confident engineering (and product) team.
At this point you might be asking "Why now?", and it would be a great question!
We've collectively decided to tackle this so early in our product's life cycle for several reasons:
- The core offering of our product requires us to interact with a series of complex external services (airline APIs, payment services, etc) that are critical to our business. Therefore, we need a way of detecting any potential anomalies that those systems present in order to react as soon as possible to them.
- We not only want to have visibility into external services but to also understand how our system is performing at any given time to ensure we're serving our customers to the highest standard possible.
- As a team we're aiming to be as data-driven as possible in our decision making, either when deciding what will be included in our roadmap or even when defining success metrics for a certain functionality which we will implement.
We're also extremely focused on building our core product and providing our users with the functionality that they need in order to build their travel businesses. This is why, from the beginning, we've decided to rely on several external tools to make this as effortless as possible.
We'll go over these tools in the next section to hopefully clarify the benefits and impact that they've already provided to us.
Google Cloud Platform
At Duffel we're really satisfied with GCPs tooling offering. In this blogpost, we'll be particularly focusing on two tools that have helped us improve our observability.
Structured Logging
This is a powerful tool which enables us to perform rich querying and aggregation on the logs emitted by our systems.
We were happy to find that this also came in handy when building an initial version of distributed tracing, with certain functions being wrapped in a timer and logged at the end to then be digested by our team.
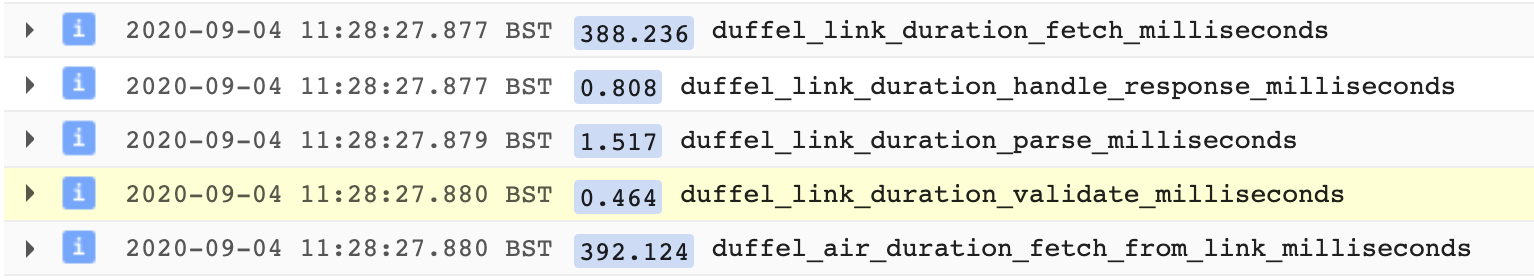
This tool alone scaled incredibly well and has already helped us detect some of the slowest operations that our system performs, understand how our product is being used as well as aid us in troubleshooting a series of customer queries.
We managed to get all of this and more out of a single tool with minimal setup on our side, by leveraging a JSON Logging library for Elixir.
Tracing
As mentioned above, almost everything that was offered by GCP's Tracer was already available to us through GCP's Distributed Logging tool. What Tracing ended up providing, aside from a more visual approach of looking at the timings of our application, was the ability to "slice and dice" our data to find particular correlations that we would otherwise have a much harder time retrieving, such as a certain operations being slow for a particular Origin/Destination pair or Airline.
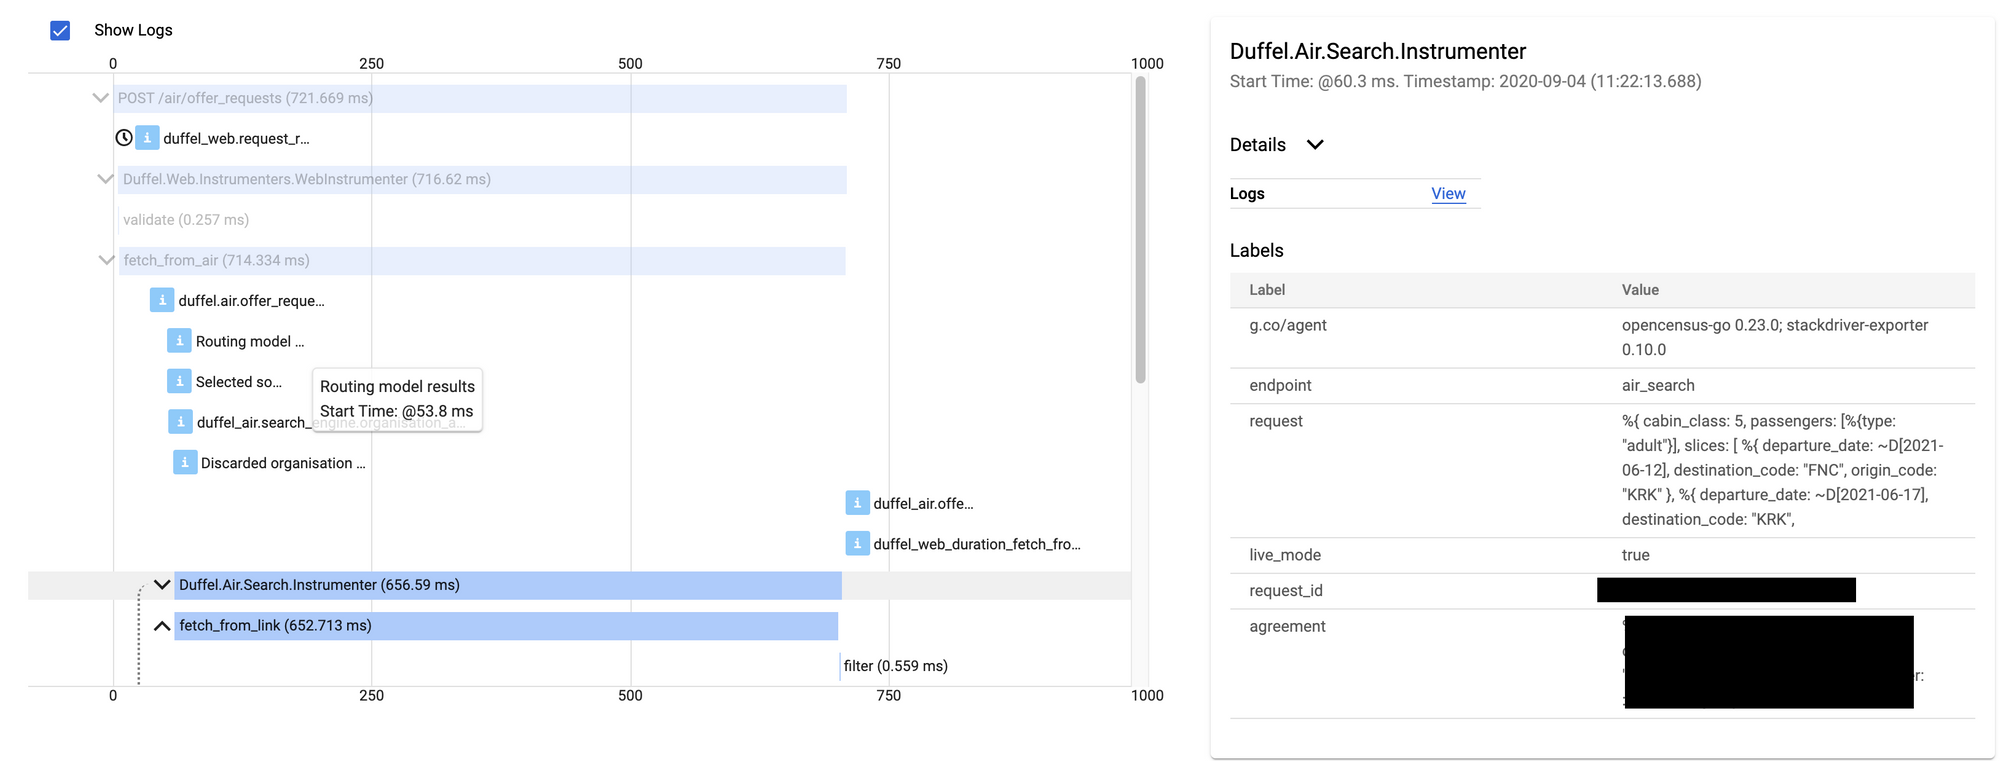
GCP also neatly connects the logs associated with each tracing step with very minimal setting up required so that you get all relevant information bundled in one tool instead of having to jump in-between the logger and the tracing tools.
Tracing as a whole, however, wasn't as simple to add to our Elixir application as we would've liked. We plan on going in more depth on that in a future blogpost.
Prometheus
Prometheus as its documentation suggests is "an open-source systems monitoring and alerting toolkit". More specifically it models the data emitted to it as a time-series, which allows you to observe how a given system is performing throughout time.
We're specifically leveraging Prometheus to get insights as close to real-time as possible into how our system is performing while also tracking the success (based on an agreed upon metric) of certain features we've built.
Prometheus itself was quite easy to get up and running with our Elixir stack by leveraging the unofficial Prometheus.ex library.
Our initial integration could only store 30 days worth of data, however, we've now transitioned into using Thanos which provides us with long term storage capabilities, but that is a topic for another future blogpost.
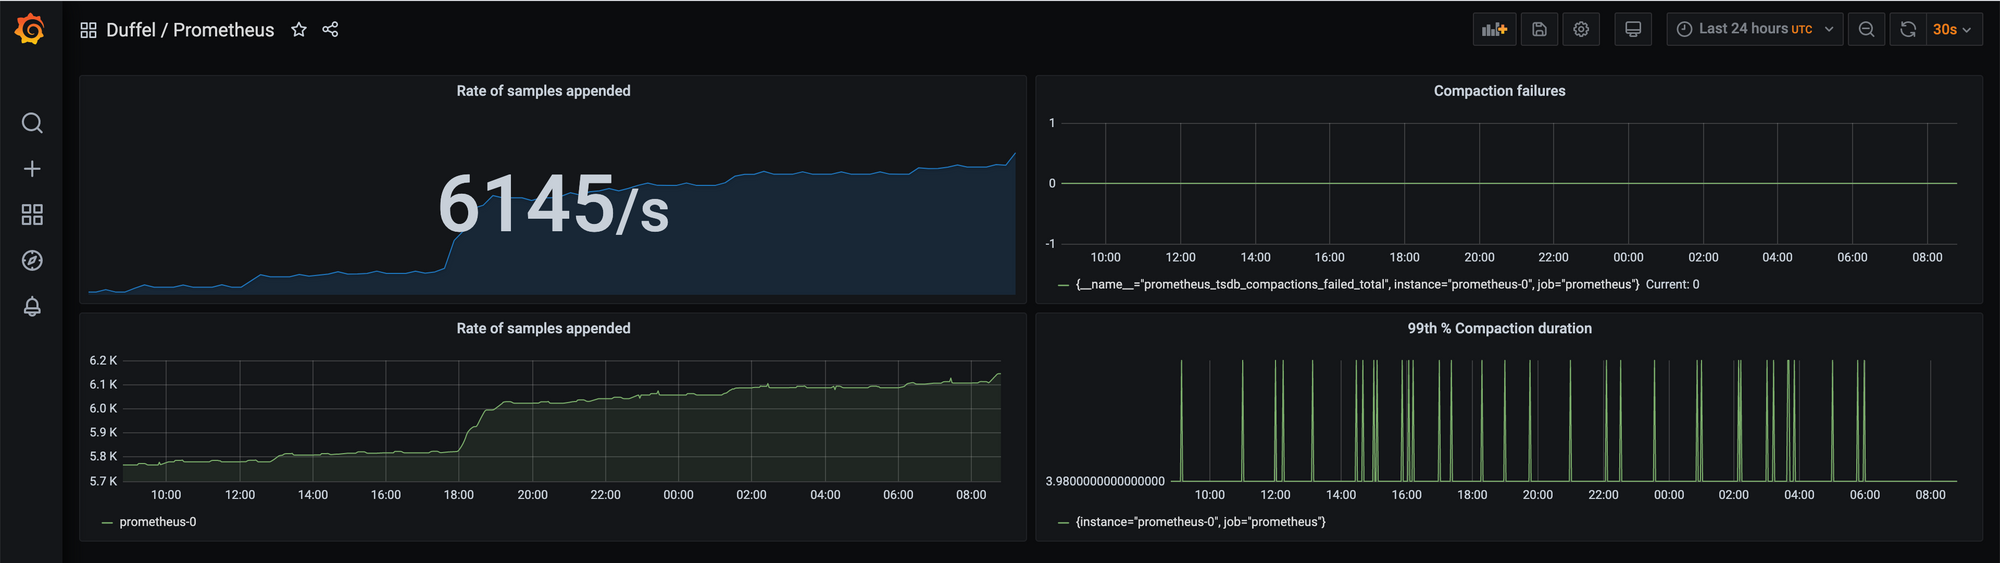
Grafana
Lastly, but definitely not least, we use Grafana, the tool that easily helps us visualize our collected data from multiple sources such as Prometheus, Postgres databases, Logs, etc and allows us to build beautiful and insightful dashboards using that information.
This tool is effectively what enables us to observe how our system is performing at any given time.
Grafana has also recently released a "Trace Viewer" for tools like Jaeger and Zipkin and we're super excited to see support for Google Cloud's Tracer being added in the future.
In conclusion, we've set out to build the smallest iteration on adding observability to our application that would deliver the most value for our current needs. As we've highlighted in a few examples above, it has already proved to be tremendously helpful in quite a number of situations from allowing us to take a closer look at how our system is performing to effectively debugging customer queries.
We plan to revisit and iterate on our Observability stack in the future (and hopefully blog more about it!).
Thank you
Latest posts
Data-Driven Travel: Using Analytics from the Duffel API to Make Smarter Business Decisions
Our latest blog post explores how companies and developers can use this tool to make smarter business decisions. Learn how to leverage booking data, implement dynamic pricing models, and use predictive modeling for future planning.

How to Take Flight: Accessing Airline Booking Capabilities to Sell Tickets
Selling flights can level-up your customer offerings... but it's complex! Our latest blog simplifies the process.

Why does developer experience matter?
At Duffel, we're building the best APIs for selling Travel online. A big part of our "secret sauce" is developer experience. We want to make it not just painless, but fun, to build websites and apps using our APIs.

Data-Driven Travel: Using Analytics from the Duffel API to Make Smarter Business Decisions
Our latest blog post explores how companies and developers can use this tool to make smarter business decisions. Learn how to leverage booking data, implement dynamic pricing models, and use predictive modeling for future planning.
Airlines
How to Take Flight: Accessing Airline Booking Capabilities to Sell Tickets
Selling flights can level-up your customer offerings... but it's complex! Our latest blog simplifies the process.
Why does developer experience matter?
At Duffel, we're building the best APIs for selling Travel online. A big part of our "secret sauce" is developer experience. We want to make it not just painless, but fun, to build websites and apps using our APIs.